Know what gets approved before you bid.
We read every officer report, code every application, and grade every finding, so you can acquire and design with evidence, not instinct.
The Problem
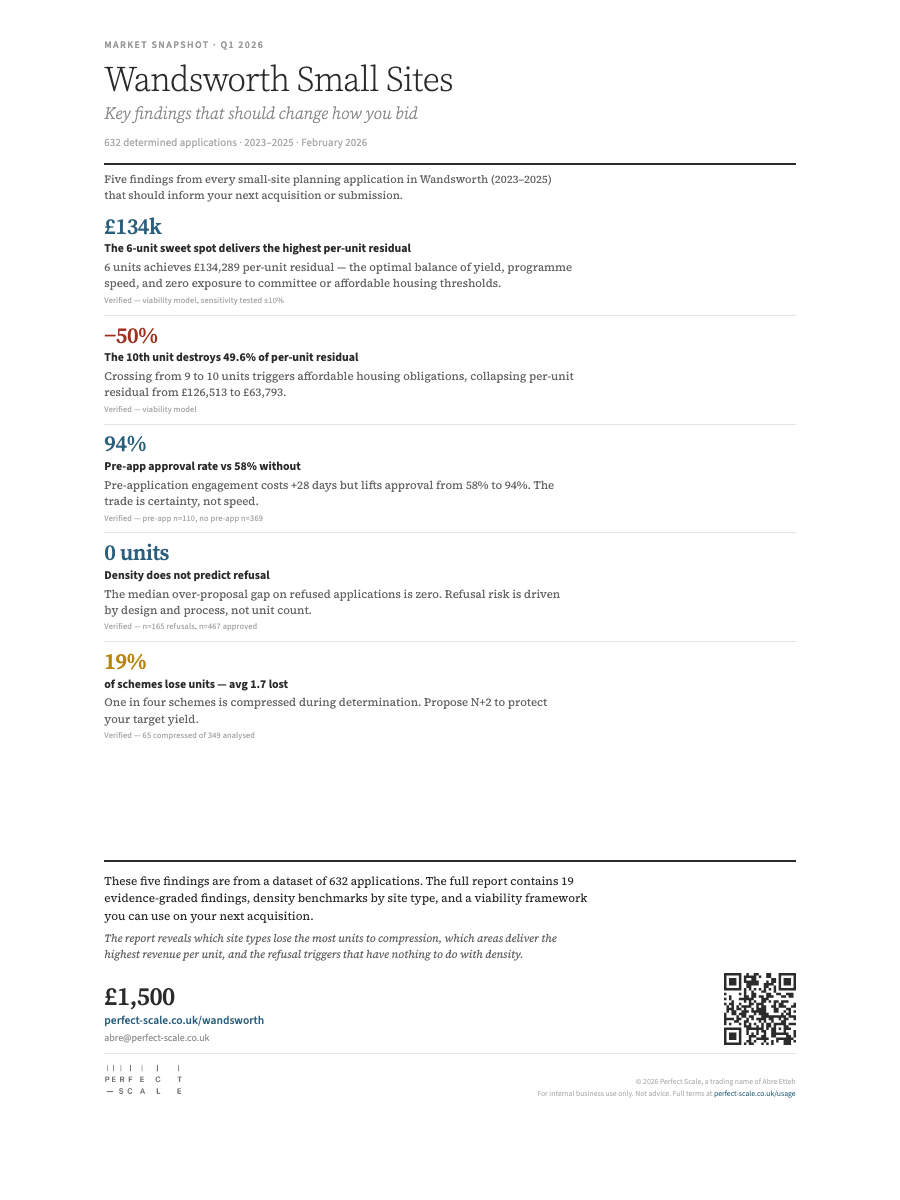
1 in 3 small-site applications across inner London boroughs is refused. That is hundreds of schemes a year that never get built.
1 in 4 approved schemes loses units during determination. The average cut is 2 units, each worth six figures in lost residual.
£20–35k in abortive fees per refused application, before you count the holding costs.
Published policy tells you what a borough wants.
Our data shows you what it actually approves.
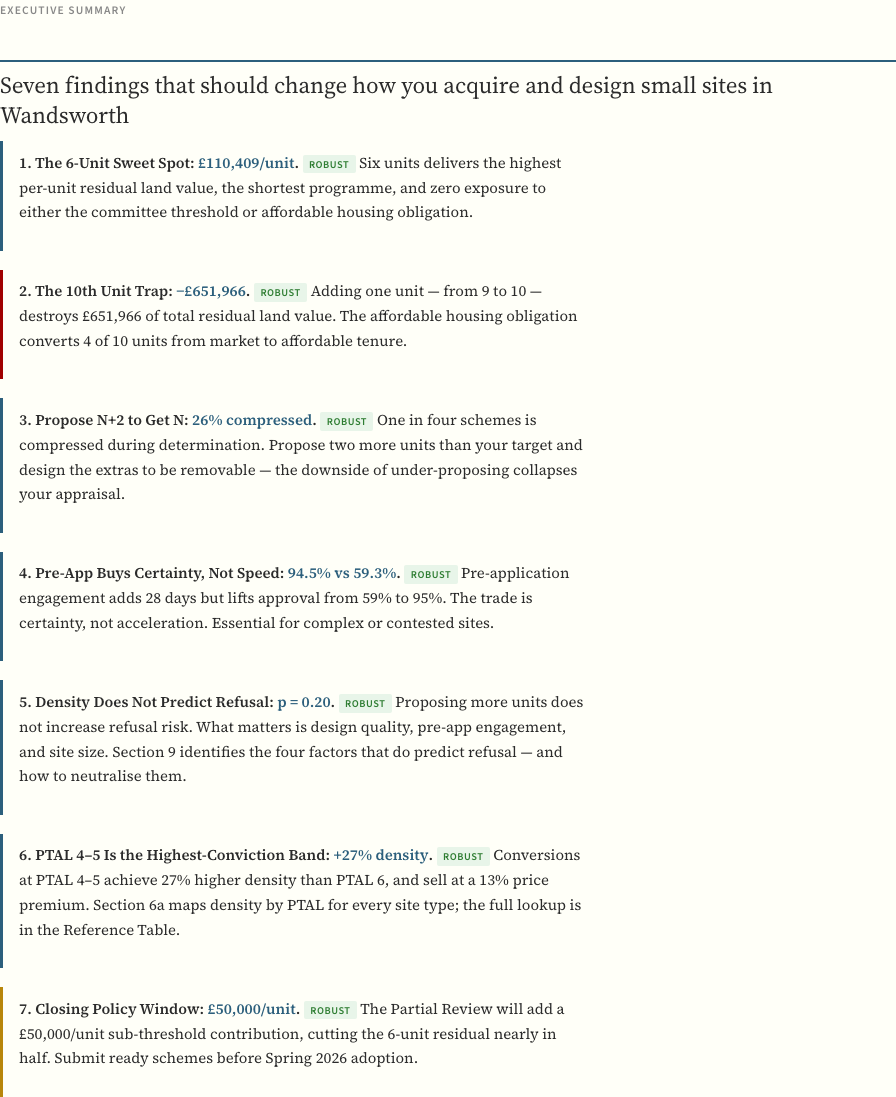
What the data reveals
Inside the report
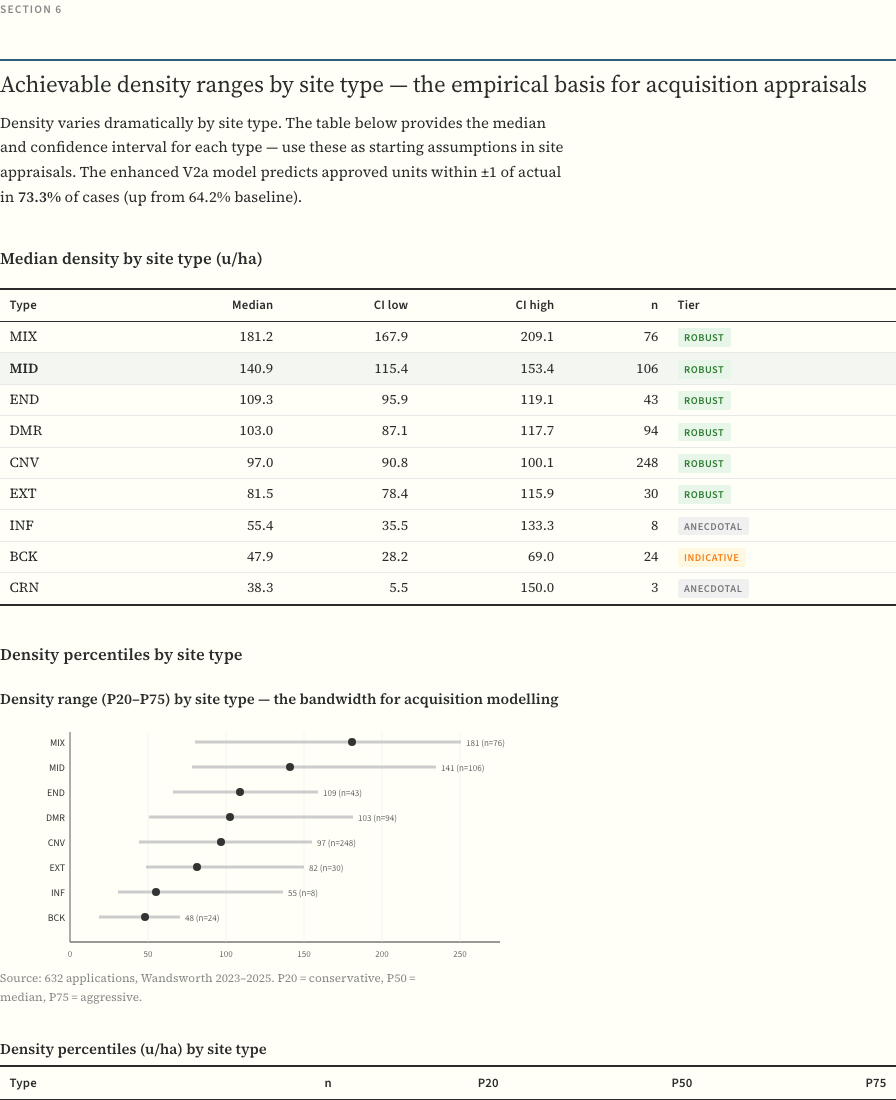
Median approved density by site type, with P20–P75 ranges and sample sizes. The starting point for every acquisition appraisal.
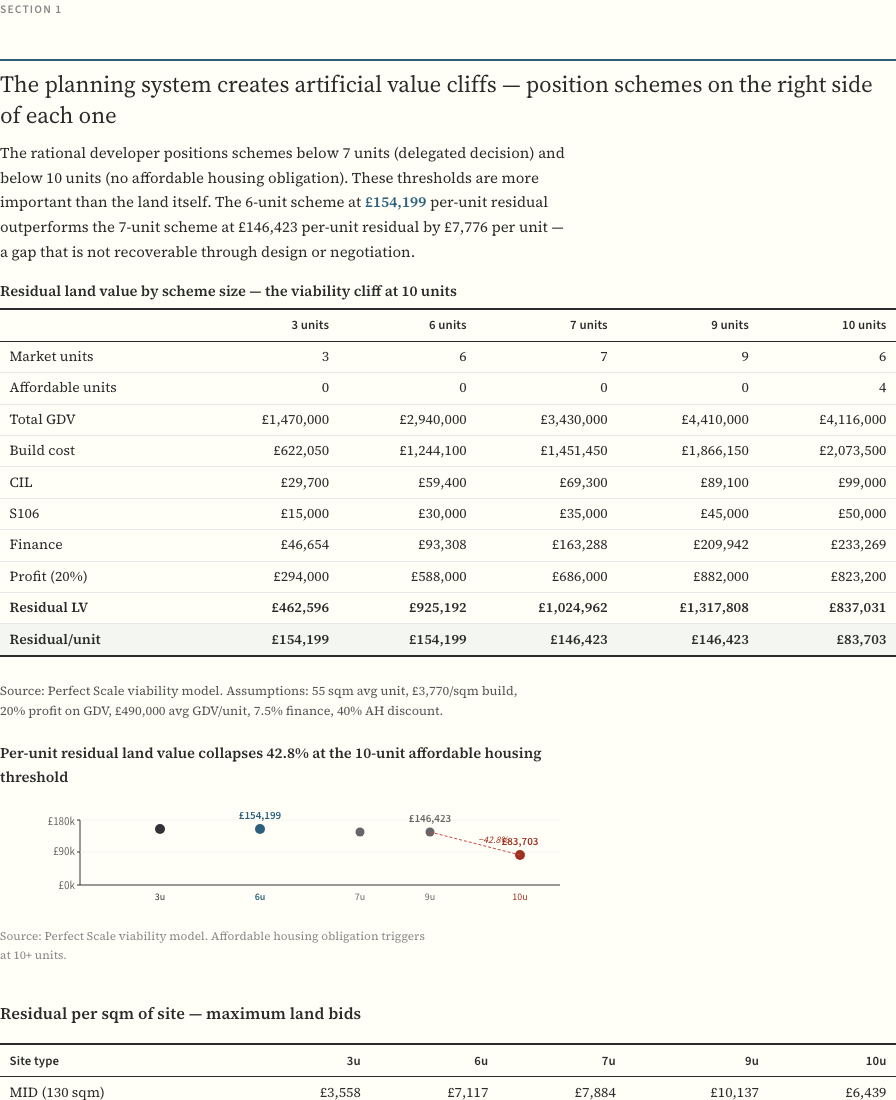
Per-unit residual by scheme size. The viability model shows exactly where affordable housing obligations collapse your margin.
Every finding graded Robust, Moderate, Indicative, or Anecdotal. No hand-waving. No unqualified claims.
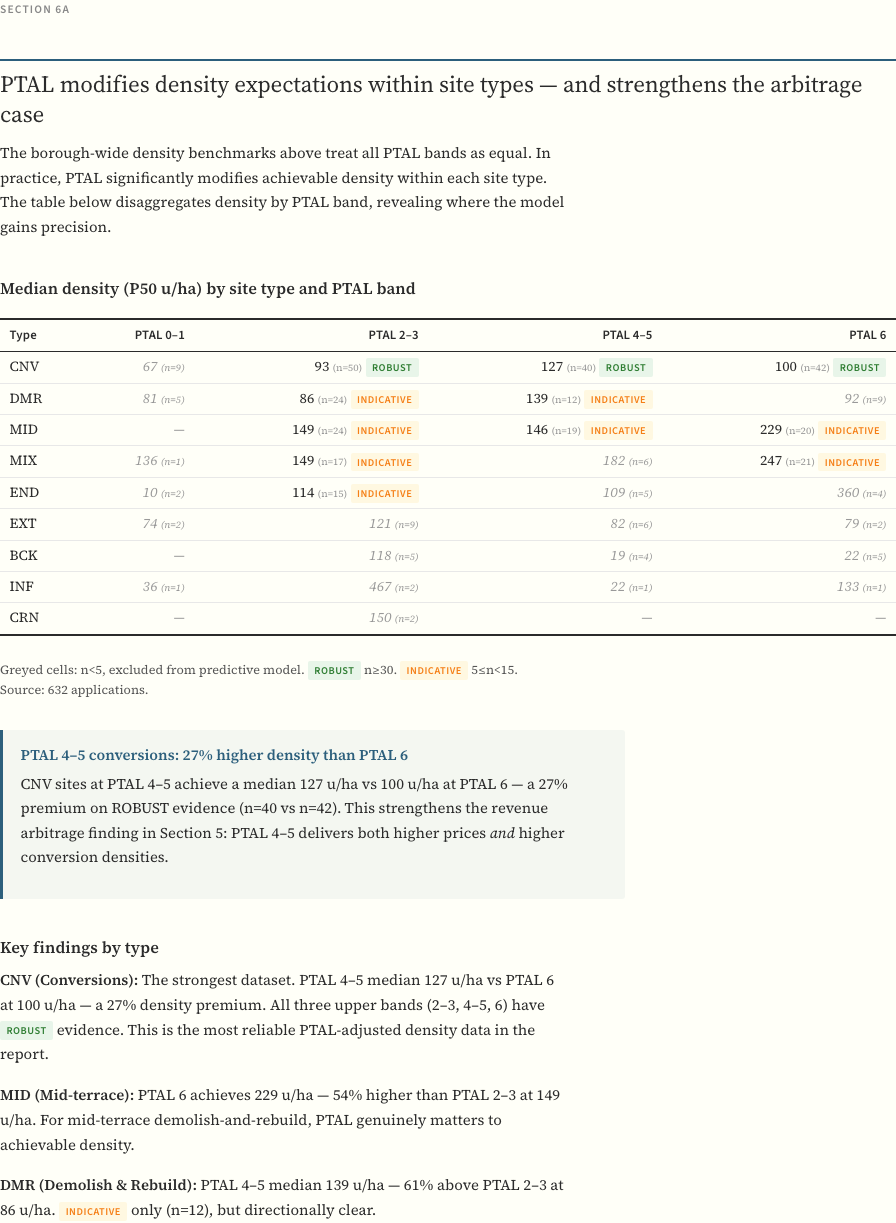
Density varies by transport accessibility within each site type. PTAL 4–5 sites consistently outperform PTAL 6 on yield.
Not ready to commit? See what the data looks like.
Download a free Market Snapshot for any London borough. Headline findings, one page, delivered to your inbox in seconds.
Get your free Snapshot →We'll send the PDF and nothing else. No drip campaigns.
How it’s made
Every application coded
3–5 years of small-site data, coded by type, area, PTAL, density, and outcome. Verified by hand.
Every document read
Officer reports read by AI, verified by hand. Refusals extracted. Design commentary captured.
Every finding graded
Four evidence tiers. Robust to Anecdotal. No unqualified claims.
About

I built the tool I wished existed.
I’ve sat on every side of this table. Designing schemes as an architect. Assessing them at a London council. Acquiring sites and managing planning as a developer. Fourteen years of watching the gap between what policy says and what officers actually approve.
The planning system has the data. Nobody was synthesising it. So I built Perfect Scale. Every finding is evidence-graded because this industry has had enough hand-waving.
Better data → better schemes → more homes.
Abre Etteh, ARB Registered Architect
Pricing
One borough report with 12 months of quarterly updates. Less than the cost of one set of revised drawings.
Stop guessing. Start knowing.
All 33 London boroughs are live. Over 15,000 applications analysed.