Wandsworth

632 determined applications · 2,100+ documents · 2019–2024
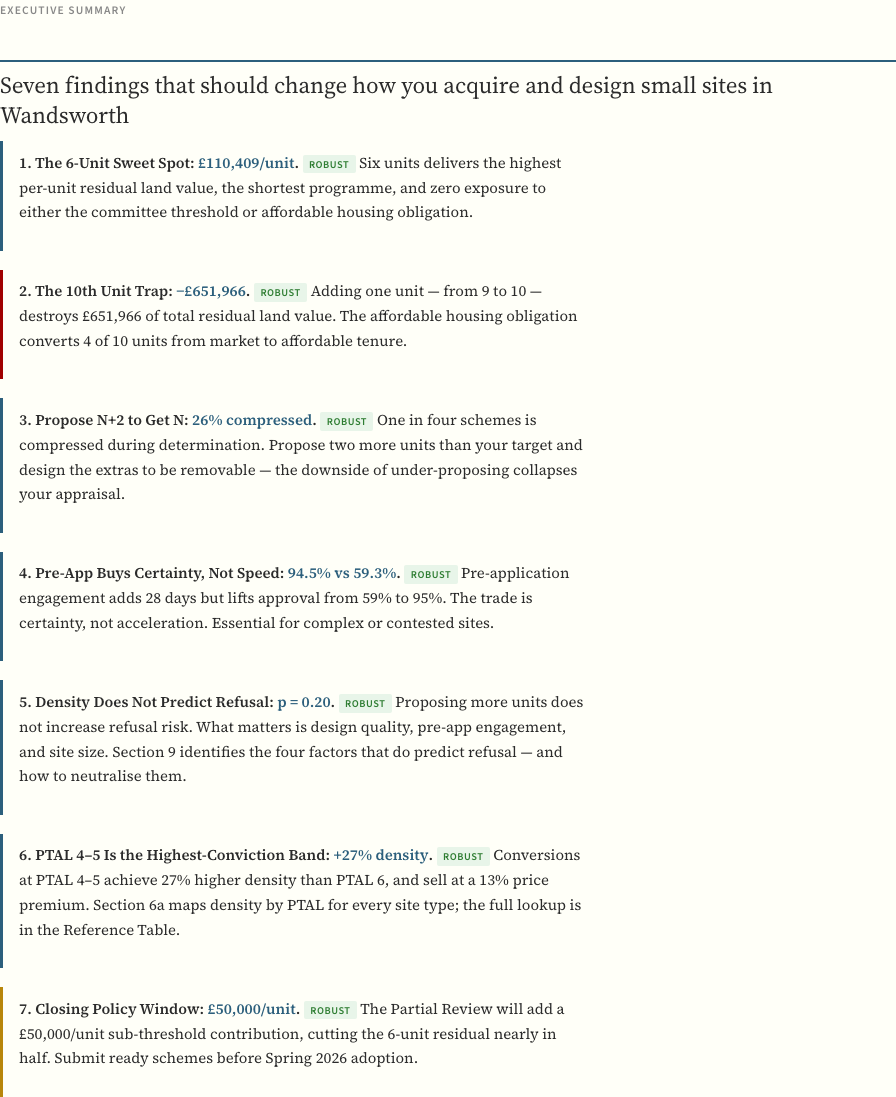
31%
Refusal rate
Small-site schemes (1–9 units)
Verified
−42%
10th unit cliff
Per-unit residual collapses at AH threshold
Verified
1.6×
Pre-app advantage
94% approval with pre-app vs 59% without
Verified
19%
Schemes cut
1 in 5 approved schemes loses units
Verified
Verified Density sweet spot: 350–500 hr/ha for conversions, 250–400 for new-build
Median approved density varies by site type. Conversions support higher density than new-build, and PTAL 4–5 sites outperform PTAL 6 on achievable yield. Based on n=344 approved applications.
Verified The 10th unit cliff: per-unit residual drops 42% at affordable housing threshold
At 10 units, affordable housing obligations trigger a step-change in scheme economics. The viability model shows 9-unit schemes consistently outperform 10–11 unit schemes on per-unit residual land value.
Verified Pre-app lifts approval from 59% to 94% (+36 points)
Pre-application engagement lifts approval rate by 36 percentage points (94.5% vs 58.5%). The effect is consistent across site types and areas. With a 31% base refusal rate, pre-app is the single most effective risk mitigant. n=110 with pre-app, n=369 without.
Verified 18.6% of approved schemes lose units during determination
Nearly 1 in 5 approved schemes is compressed during the planning process. The average reduction is 1.7 units (median 1), each worth six figures in lost residual land value. 71% of schemes pass through unchanged, and 10% are actually expanded. n=349 approved applications.
Verified Conservation areas add 8–12% refusal risk
Applications in conservation areas face materially higher refusal rates. The effect is strongest for new-build and extension schemes where visual impact is greatest.
Moderate Committee referral correlates with lower approval rates
Schemes referred to committee have lower approval rates than delegated decisions. Committee schemes also incur longer determination periods, increasing holding costs.
Moderate Design quality is the most-cited refusal reason
Across all refusals, design quality and character/appearance are cited more frequently than any other grounds. This applies to both new-build and conversion schemes.
Moderate Approval rates vary significantly by ward
Ward-level approval rates range from under 45% to over 80%. The report maps every ward and identifies which areas are most and least favourable for small-site development.
Density matrix showing median densities by site type

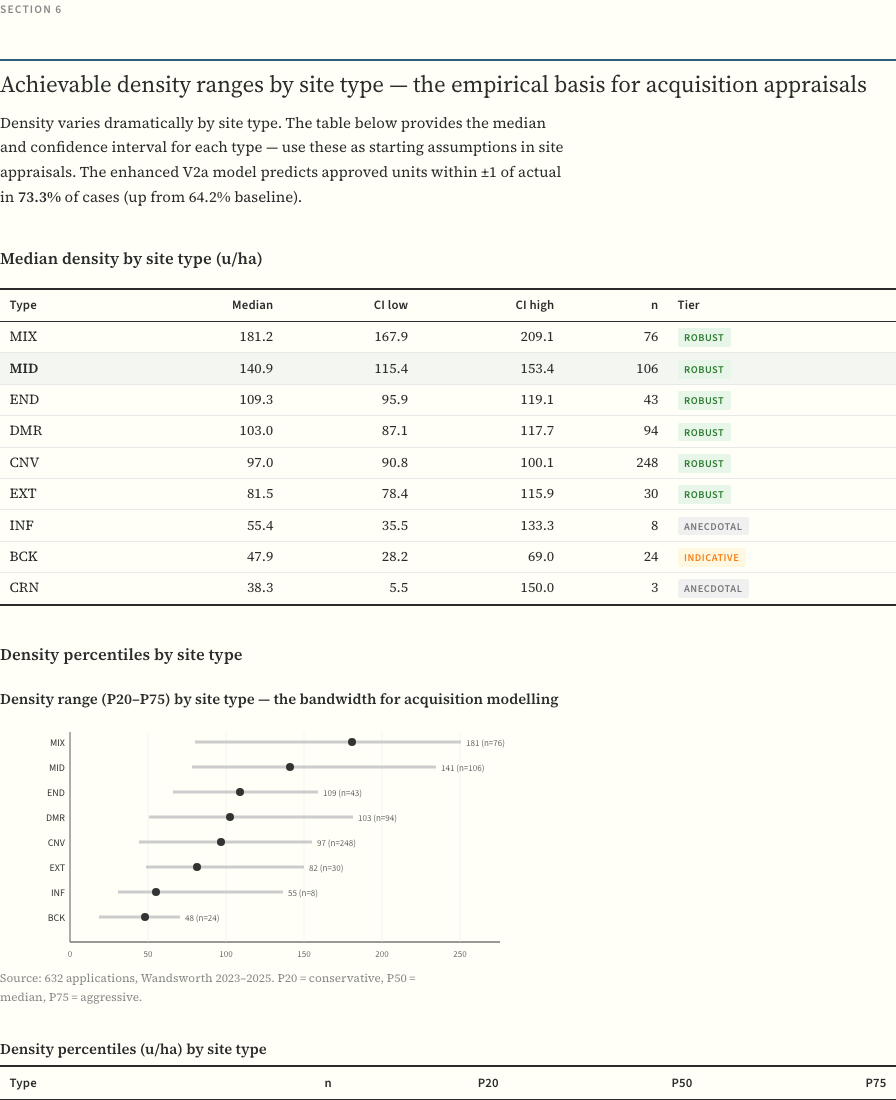
Median approved density by site type, with P20–P75 ranges and sample sizes. The starting point for every acquisition appraisal.

Viability table and cliff chart

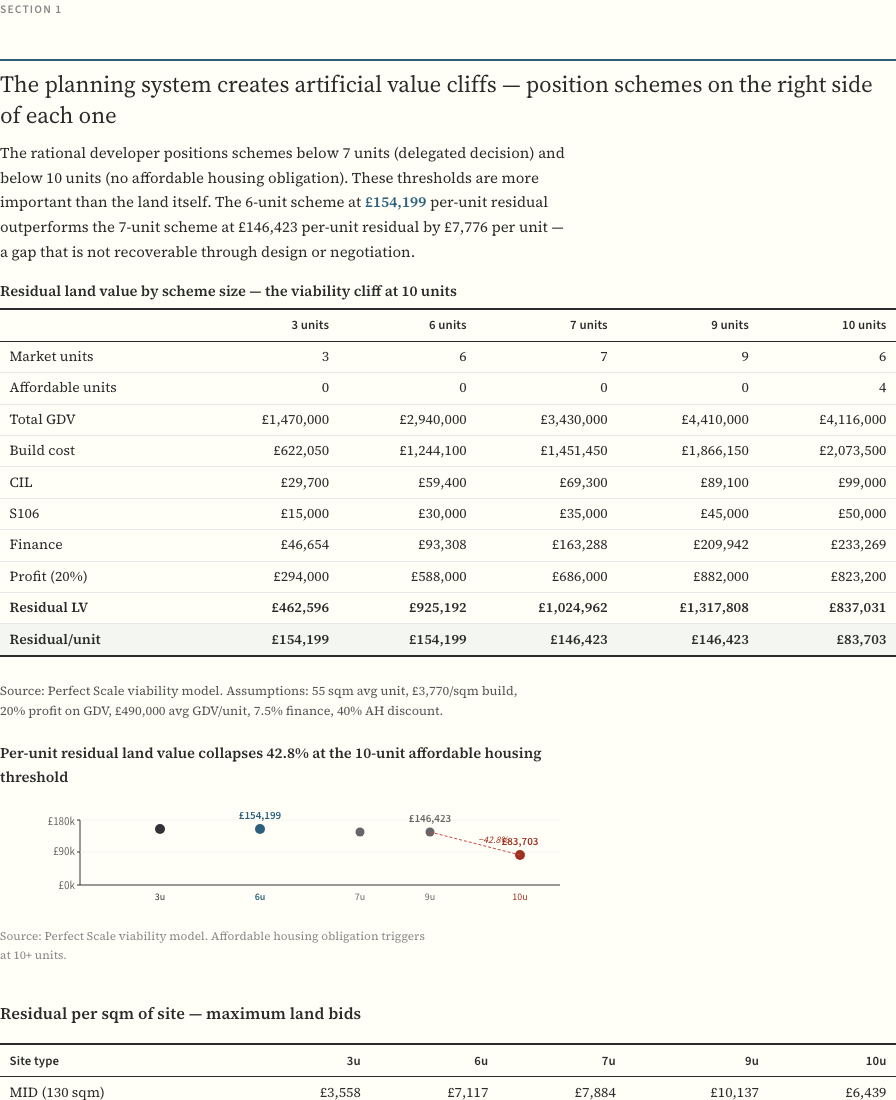
Per-unit residual by scheme size. See exactly where affordable housing obligations collapse your margin.

Executive summary with evidence-graded findings

Every finding graded Robust, Moderate, Indicative, or Anecdotal. No hand-waving. No unqualified claims.

PTAL-adjusted density lookup table

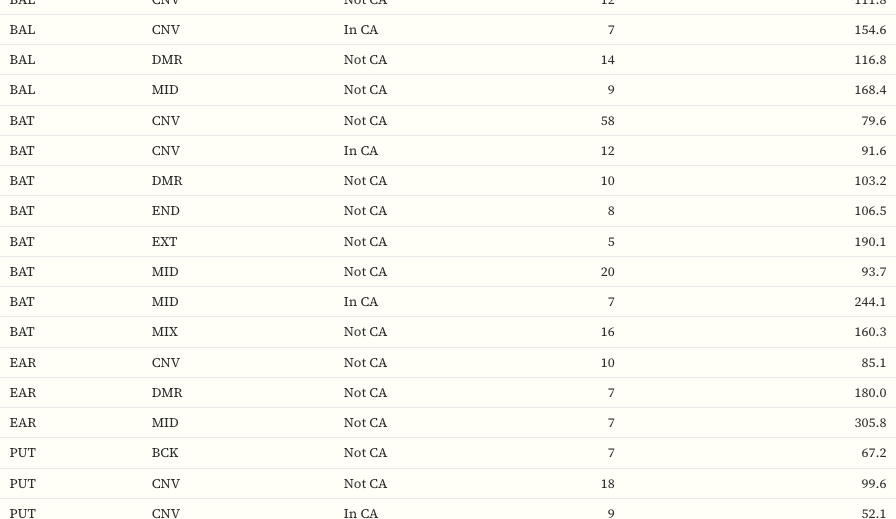
Look up your site type and PTAL band. Get the median approved density and confidence interval in seconds.

The full report

  • 40+ page report (HTML & PDF) with all 21 evidence-graded findings
  • Density matrix by site type with P20–P75 ranges
  • PTAL-adjusted density lookup table
  • Viability model with cliff chart and sensitivity analysis
  • Ward-level and area-level approval rate maps
  • Refusal reason analysis with frequency data
  • Conservation area risk assessment
  • Case officer patterns and committee benchmarks

Decision tools

  • Before-you-bid checklist: site-level due diligence prompts
  • Before-you-submit checklist: application quality checks
  • One-page Market Snapshot for quick reference
  • Underlying data in Excel for your own analysis

Methodology

  • Complete dataset, not a sample — every determined application
  • Backtested density model: 73% within ±1 unit, 90% within ±2
  • Four evidence tiers: Robust, Moderate, Indicative, Anecdotal
73%

Predicted within ±1 unit of actual

90%

Predicted within ±2 units of actual

+0.06

Near-zero prediction bias

V2a Cascade model, n=344 approved applications. Accuracy scales with evidence tier: Robust cells are 37% more accurate than Anecdotal.

Borough Intelligence Reports from £1,500. Includes 12 months of free quarterly updates.

View pricing →

Reports delivered via the members’ platform. Includes HTML & PDF report, Excel data, and Market Snapshot.

Want to see the data before you buy?

Download the free Wandsworth Market Snapshot. Five findings, one page, no commitment.